
Introduction
One is increasingly aware that digital content creation consumes energy, and that consumption translates into greenhouse gas emissions. This guide explains how to benchmark the carbon footprint of AI article pipelines, offering step‑by‑step methods, real‑world examples, and practical recommendations for reduction. By following the procedures outlined herein, organizations can measure emissions, compare performance, and implement evidence‑based improvements.
Understanding the Carbon Footprint Concept
The term carbon footprint refers to the total amount of carbon dioxide equivalent (CO2e) emitted directly or indirectly by an activity. In the context of AI‑driven content generation, emissions arise from data storage, model training, inference, and post‑processing. Measuring these emissions requires converting energy usage, expressed in kilowatt‑hours (kWh), into CO2e using region‑specific emission factors.
Components of an AI Article Pipeline
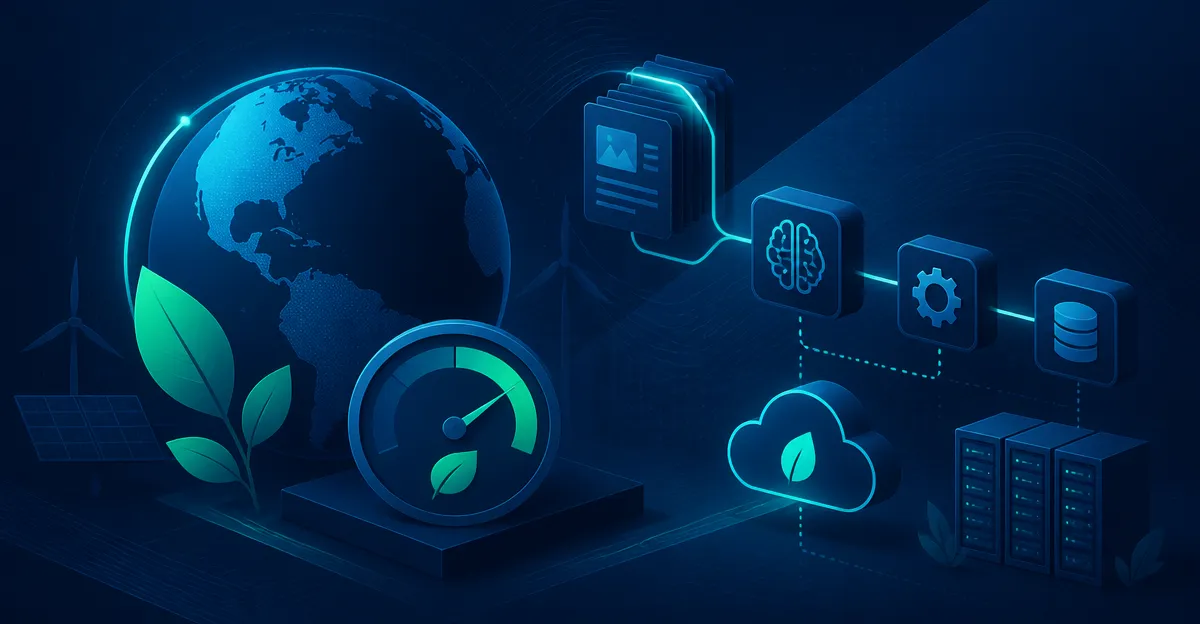
An AI article pipeline typically consists of data ingestion, preprocessing, model training, inference, editing, and publishing. Each stage consumes computational resources that contribute to the overall carbon footprint. Understanding the energy profile of each component enables targeted benchmarking and optimization.
Data Ingestion and Preprocessing
During ingestion, raw text, images, and metadata are transferred to storage systems. Preprocessing may involve tokenisation, cleaning, and vectorisation, all of which require CPU cycles. Although these steps are often overlooked, they can account for up to fifteen percent of total energy use in large‑scale pipelines.
Model Training
Training large language models (LLMs) is the most energy‑intensive phase. GPUs or specialised accelerators operate at high power draw for days or weeks, generating the bulk of emissions. For example, training a 6‑billion‑parameter model on a single GPU cluster for 72 hours can emit roughly 3 tonnes of CO2e, depending on the electricity mix.
Inference and Post‑Processing
Inference occurs each time the model generates an article draft. Although each inference event consumes less power than training, high request volumes amplify the impact. Post‑processing steps such as grammar checking, plagiarism scanning, and formatting also require compute resources.
Step 1: Define the Scope of Measurement
One must first decide whether to adopt a Scope 1, Scope 2, or Scope 3 accounting framework. Scope 1 covers direct emissions from owned equipment, Scope 2 includes indirect emissions from purchased electricity, and Scope 3 captures upstream and downstream activities such as cloud provider emissions. For most organisations, a hybrid Scope 2 + Scope 3 approach yields the most accurate carbon footprint benchmark for AI article pipelines.
Step 2: Collect Energy Consumption Data
Accurate data collection is essential. Energy metrics can be obtained from:
- Cloud provider dashboards (e.g., AWS Cost Explorer, Azure Monitor) that report kWh per service.
- On‑premise power meters attached to GPU racks.
- Software tools such as CodeCarbon or Experiment‑Impact‑Tracker that instrument code to log energy usage.
One should record consumption for each pipeline stage over a representative period, typically one month, to capture variability.
Step 3: Convert Energy Use to CO2e
The conversion uses emission factors supplied by regional electricity authorities or the International Energy Agency. The formula is:
CO2e (kg) = Energy (kWh) × Emission Factor (kg CO2e/kWh)For example, if a pipeline consumes 5,000 kWh in a month and the local emission factor is 0.45 kg CO2e/kWh, the resulting emissions equal 2,250 kg CO2e.
Step 4: Establish a Baseline Benchmark
One creates a baseline by averaging monthly CO2e values over a three‑month window. This baseline serves as a reference point for future comparisons. It is advisable to document the hardware configuration, model size, and dataset characteristics alongside the baseline, because changes in any of these variables affect emissions.
Step 5: Compare Against Industry Benchmarks
Several public repositories publish average emissions for common AI tasks. The “CarbonTracker” project, for instance, reports that fine‑tuning a 1.5 billion‑parameter model typically emits 0.8 tonnes CO2e per 100 hours of GPU time. By aligning one’s own metrics with such benchmarks, one can assess whether the pipeline is above, below, or on par with industry standards for the carbon footprint benchmark for AI article pipelines.
Step 6: Identify Reduction Opportunities
After benchmarking, one should evaluate optimisation levers. Common strategies include:
- Switching to energy‑efficient hardware such as NVIDIA H100 GPUs, which deliver higher performance per watt.
- Utilising renewable‑energy‑powered cloud regions (e.g., Google Cloud’s “us‑central1‑a” zone).
- Applying model compression techniques like quantisation or pruning to reduce inference load.
- Scheduling training jobs during off‑peak hours when the grid mix is greener.
Each lever can be quantified by re‑running the energy measurement after implementation and observing the delta in CO2e.
Tools and Platforms for Carbon Benchmarking
Several open‑source and commercial tools simplify the benchmarking workflow:
- CodeCarbon – a Python library that estimates emissions based on hardware utilisation and location.
- Experiment‑Impact‑Tracker – integrates with PyTorch and TensorFlow to log energy and emissions per experiment.
- Microsoft Sustainability Calculator – provides cloud‑wide emissions reporting for Azure resources.
- Google Cloud Carbon Footprint API – offers real‑time emissions data for GCP services.
One should select a tool that aligns with the existing technology stack and reporting requirements.
Real‑World Case Study: MediaCorp Publishing
MediaCorp adopted an AI pipeline to generate daily news briefs. Initial measurements revealed an average monthly emission of 3.2 tonnes CO2e, exceeding the industry benchmark by 25 percent. By migrating inference workloads to a renewable‑energy‑powered region and applying 8‑bit quantisation to the language model, MediaCorp reduced emissions to 2.1 tonnes CO2e, representing a 34 percent improvement. The case demonstrates how benchmarking can guide concrete actions.
Pros and Cons of Different Benchmarking Approaches
Three primary approaches exist: manual meter reading, cloud‑provider APIs, and instrumented software libraries. Each has advantages and drawbacks.
Manual Meter Reading
Pros: Direct measurement, high accuracy for on‑premise hardware. Cons: Labor‑intensive, limited scalability, prone to human error.
Cloud‑Provider APIs
Pros: Automated data collection, integrates with billing. Cons: May lack granularity for individual pipeline stages, depends on provider transparency.
Instrumented Software Libraries
Pros: Fine‑grained attribution to code paths, easy integration with CI pipelines. Cons: Estimates rely on power models, which may not capture hardware variations.
Best‑Practice Checklist
- Define scope (Scope 2 + Scope 3) before data collection.
- Use region‑specific emission factors for conversion.
- Record hardware configuration and model parameters alongside energy data.
- Establish a three‑month baseline before implementing changes.
- Compare results with publicly available carbon footprint benchmark for AI article pipelines.
- Document optimisation steps and re‑measure to verify impact.
- Report findings to stakeholders using clear visualisations.
Future Trends in Carbon‑Aware AI Development
Emerging trends suggest that carbon benchmarking will become integral to AI governance. Anticipated developments include:
- Standardised industry certifications for low‑carbon AI pipelines.
- Integration of emissions metrics into model registries and MLOps platforms.
- Policy incentives that reward organisations for achieving carbon‑neutral AI operations.
Staying informed about these trends will enable one to future‑proof the benchmarking strategy.
Conclusion
Benchmarking the carbon footprint of AI article pipelines requires a systematic approach that combines accurate data collection, conversion to CO2e, baseline establishment, and comparison against industry standards. By following the six‑step methodology, leveraging appropriate tools, and applying targeted optimisation levers, organisations can achieve measurable emission reductions while maintaining content quality. The ultimate goal is to embed sustainability into the core of AI‑driven publishing, ensuring that digital innovation does not compromise environmental responsibility.
Frequently Asked Questions
What is a carbon footprint in the context of AI‑generated content?
It is the total CO2e emissions produced directly or indirectly by the AI pipeline, calculated from the energy used in storage, training, inference, and post‑processing.
How do you convert energy usage (kWh) into CO2e for AI workloads?
Multiply the kWh consumed by the region‑specific emission factor, which reflects the local electricity generation mix.
Which stages of an AI article pipeline contribute most to its carbon footprint?
Data ingestion, preprocessing, model training, and inference typically consume the most compute power, while editing and publishing add smaller amounts.
What are the basic steps to benchmark the carbon footprint of an AI article pipeline?
Measure energy use per pipeline stage, apply regional emission factors, sum the CO2e values, and compare against baseline or industry benchmarks.
How can organizations reduce the carbon emissions of their AI content creation process?
Optimize model size, use efficient hardware, schedule jobs during low‑carbon grid periods, and reuse pretrained models to lower overall energy demand.